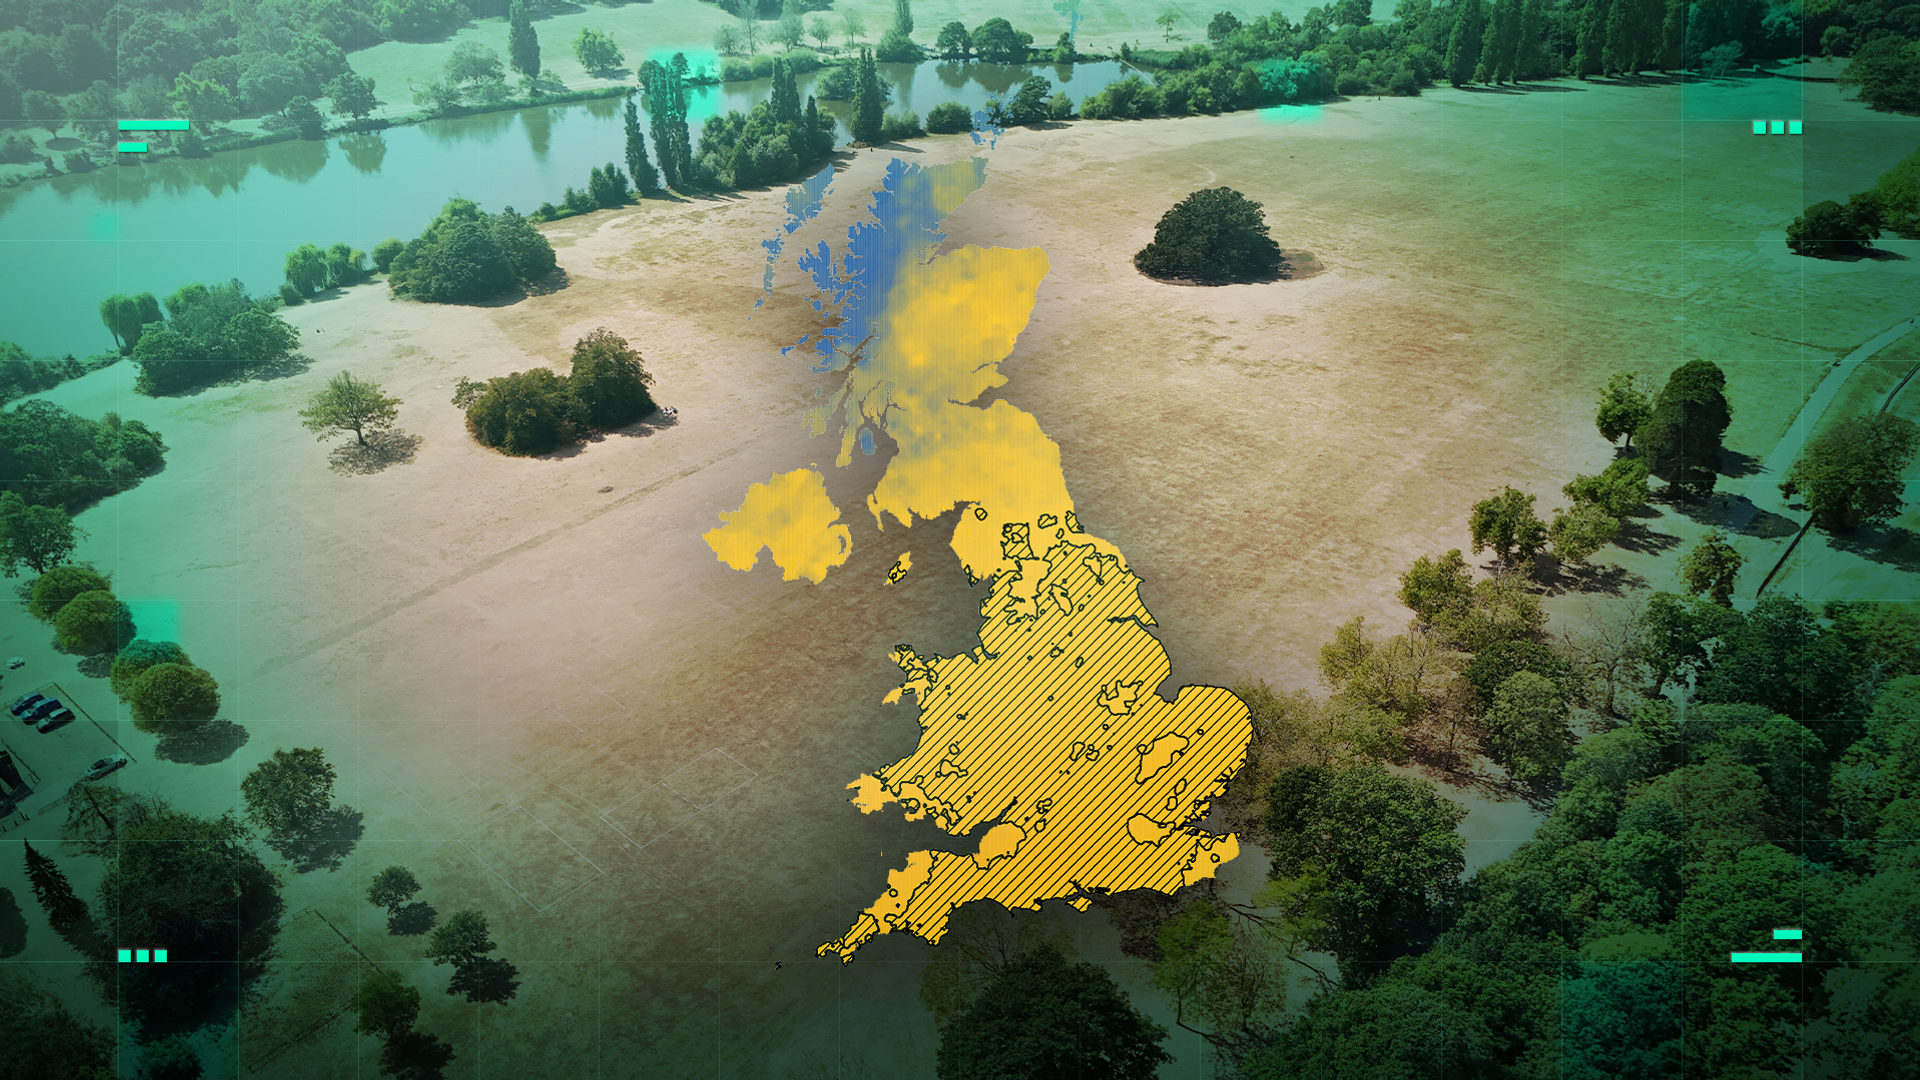
Every time you look outside and wonder why winter feels like spring or why a random Tuesday brings torrential downpours that turn your street into a river, you aren't imagining things. Local weather patterns are shifting dramatically. Traditional forecasts tell you whether to grab an umbrella, but they rarely explain if what you are experiencing is normal. Understanding how unusual your local weather actually is requires looking past daily forecasts and diving into historical climate data, attribution tools, and meteorological tracking systems.
Most people rely entirely on short-term apps that update every ten minutes. These apps excel at telling you if it's raining right now, but they fail completely at context. They don't tell you that your current temperature is breaking a 50-year record, nor do they show how extreme local shifts fit into broader environmental changes. If you want to know how weird your weather really is, you need to look at data science tools designed to analyze climate attribution and historical weather anomalies.
Why Standard Weather Forecasts Fall Short
Daily weather apps suffer from a severe lack of long-term memory. When your phone says it is 72 degrees in October, it simply reports the current temperature without telling you that the normal average for this exact week used to be 58 degrees. This amnesia creates a false sense of normalcy. You adjust to the warmth, forgetting how seasonal transitions used to feel.
Meteorological stations have collected decades of baseline data, yet consumer apps rarely surface this information. Instead, they chase immediate engagement through push notifications about storms and heatwaves. To truly understand local weather anomalies, scientists rely on standardized indexes like the Climate Shift Index or historical anomaly trackers provided by meteorological agencies such as the National Oceanic and Atmospheric Administration (NOAA) or the Met Office.
These platforms calculate how much human-driven climate change has influenced a specific day's temperature or rainfall in your exact zip code. When you run your location through these analytical tools, the results often shock you. A warm afternoon isn't just a nice day; it might be an event that would be statistically impossible without long-term atmospheric shifts.
How Climate Attribution Tools Actually Work
Attribution science used to take months or years of academic study following a major weather event. Researchers would run massive supercomputer simulations to determine whether a specific drought or heatwave was linked to global warming. Today, automated digital tools make these calculations accessible to anyone with an internet connection.
These interactive weather attribution tools compare two distinct climate models. The first model represents our actual world with increased greenhouse gases, while the second model simulates an alternate Earth without human influence. By comparing the likelihood of a specific weather pattern occurring in both models, the software assigns a local score or ratio.
If a tool shows a local temperature anomaly carrying an attribution index of 5, it means that particular weather pattern is at least five times more likely to happen today than it would have been in a pre-industrial climate. Suddenly, your backyard weather station data connects directly to a global narrative. You aren't just dealing with a random hot afternoon; you are witnessing measurable environmental transformation right outside your window.
Moving Beyond the Daily Forecast Loop
If you want to stop guessing about local weather trends and start understanding the data, you need to change your habits. Stop treating weather apps as simple text alerts and start using them as investigative instruments.
- Check historical baselines: When looking at forecasts, check the record highs and lows for the date rather than just the current prediction. Knowing the gap between average and actual temperatures reveals the true scale of an anomaly.
- Explore open-source climate maps: Organizations like Climate Central publish public-facing tools that let you input your city or region to see daily climate shift scores.
- Track local microclimates: Urban heat islands make cities significantly warmer than surrounding rural areas. Notice how concrete, asphalt, and lack of green spaces amplify extreme weather where you live.
Weather isn't just background noise for your commute anymore. It is an active, changing system that demands more than a quick glance at a smartphone screen. By digging into the historical data and utilizing modern attribution metrics, you transform yourself from a passive observer into someone who actually understands what is happening in the skies above your neighborhood.